
The “Nifty Fifty” Becomes the “Nifty Five”
Global capital markets were broadly higher in the second quarter, continuing the trend from Q1. Within our typical client portfolios, 10 of 12 asset classes notched positive returns for the quarter (your own portfolio results may differ – please refer to your Quarterly Portfolio Review Report). The following table shows the recent benchmark returns for every asset class in a 60/40 model portfolio, for the periods ending June 30, 2017:


Year-to-date, the only category still in negative territory is natural resources, where weakness in energy markets (primarily oil and natural gas) has outweighed recent positive trends in precious metals and agricultural commodities. Moreover, returns for this category are negative in trailing 3, 5, and 10-year periods. Even though our allocation to natural resources is quite small, this persistent lag is possibly a source of frustration to many clients, so it’s worth revisiting the role these assets play in the portfolio.
Commodities prices are volatile because their short-term supply curves are relatively “inelastic.” Producers generally need several months, even years in some cases, of lead time to increase their production capacity: crops have an annual or bi-annual growing season, metals require construction and permitting of new mines, and new oil & gas reserves require years of intensive geological research. Therefore, interruptions in supply (or unforeseen surges in demand) boost short-term prices, signaling to the market the need to invest in additional capacity. Eventually, the market responds to this price signal, but due to the long production cycle inherent in these types of extraction businesses, producers frequently overshoot demand and the resulting glut causes prices to fall once again. Thus, commodities cycles tend to last several years, with prices exhibiting positive or negative momentum. The chart below compares the relative valuation of a major commodity index (GSCI) with the S&P 500 stock index through several of these cycles:
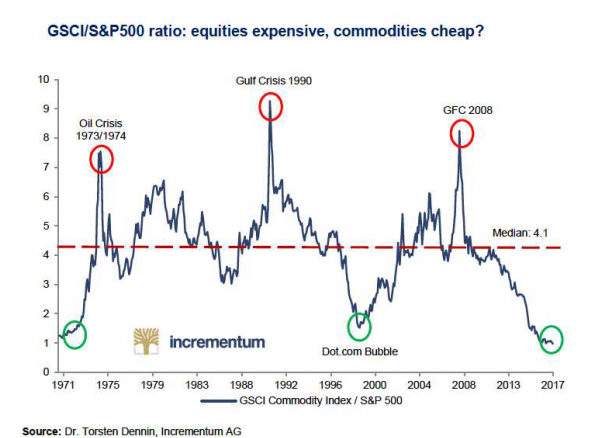
 Today, the GSCI index is cheaper relative to the S&P 500 than it has been in decades. This is not to say that commodities are necessarily poised for a rebound (it could also indicate that stocks are expensive), but we do know that natural resources (unlike most other financial assets) have a high positive correlation to sudden increases in inflation, and therefore have an important niche role to play in diversifying the portfolio. Within our natural resources allocation, we made one minor change during the quarter, which was to perform a non-taxable exchange of your shares in the RS Victory Global Natural Resources Fund, into a newly-launched “institutional” share class of the same fund, saving 0.33% annually in expenses.
Turning to domestic equities, Large Cap stocks (and particularly “Growth” stocks) continued what has been an exceptional multi-year period of outperformance. Morningstar’s index of U.S. Large Cap Growth stocks outperformed the Large Cap Value index by 5.6% in Q2, and by 4.4% annually over the past decade. There are many possible explanations for this trend. First, with economic growth sluggish since the Great Recession, many investors seem willing to pay a larger premium for faster-growing companies. Second, a decade of sustained low interest rates means that future corporate earnings are discounted at a lower rate (i.e. that they are worth more in today’s dollars, bidding up Price-to-Earnings’ multiples). Third, low interest rates have facilitated a wave of mergers & acquisitions, consolidating the stock market into fewer and larger publicly-traded companies (the kind which tend to dominate the ranks of market-capitalization weighted indexes such as the S&P 500). Finally, a the long secular trend toward passive investing picked up steam in recent years, resulting in a proliferation of new investment products designed to track major indexes. The Wall St. Journalrecently reported that Exchange-Traded Funds (ETFs) bought $98 billion worth of U.S. stocks in the first quarter of this year, an annual pace which would exceed the last two years combined. As more money flows into passive funds tracking market-capitalization weighted indexes, the largest stocks in these indexes become larger still. Consider the 5 largest companies in the S&P 500 (which collectively comprise 12.3% of the index):


Each of the companies above has substantially outperformed the overall index this year—despite the fact that all of them (except Apple) command earnings multiples significantly higher than the broader market (which is already historically elevated itself). It will be interesting to see whether passive investors are really “passive” when the next market correction arrives (or whether higher interest rates reduce the attractiveness of a sub-3% earnings yield).
Even larger than the performance difference between domestic growth and value stocks, is the difference between U.S. and International stocks. Over the past 10 years, the MSCI EAFE index of developed non-U.S. stocks lagged the S&P 500 index by 5.7% per year (it lagged by 8% annually over the past 3 years). This is the highest discrepancy in relative valuation in at least 15 years:


As discussed in our last monthly commentary, this relatively wide valuation gap is partly what prompted our recent decision to increase our allocation to international stocks in client portfolios. Another factor (alluded to above) is that the shrinking size of the public U.S. equity markets means that by not rebalancing toward international stocks, we exacerbate a “home country bias”—resulting in sub-optimal portfolio diversification. As it happens, international stocks have outperformed thus far in 2017 (though much of this is due to strengthening of foreign currencies vs. the U.S. dollar). Even so, we think that foreign stock valuations remain relatively attractive, compared to those in the U.S.
In June, the Federal Reserve raised the Fed Funds rate for the second time this year (and the fourth time since late 2015), to a target range of 1% to 1.25%. Importantly, the Fed also revealed the plan for gradually unwinding its $4.5 trillion balance sheet—largely comprised of government and agency debt purchased through 3 successive waves of “quantitative easing” in the wake of the 2007-08 global financial crisis. The Fed’s plan is to begin letting some of these bonds mature over time, without reinvesting the proceeds in new issues. This figures to be a more orderly de-leveraging process than large-scale bond sales (which would run the risk of an undesirably rapid rise in interest rates).
The Fed’s actions have boosted yields on short term bonds by about 50 basis points so far this year. Meanwhile, economic growth remains muted and inflation is still below the Fed’s target of 2%, which has also supported pricing for long-term bonds. The result is a compression in spreads between short-term and long-term rates:


Investment grade bonds have continued to earn positive, yet modest returns (the Barclays Aggregate Bond index rose 1.4% in Q2 and 2.3% over the first half of 2017). With inflation still below the Fed’s normalized target, inflation-protected bonds (TIPS) lagged the broader bond market (up less than 1% through the first half). Global bonds (driven by currency tailwinds), corporate debt (shrinking credit spreads), and muni bonds (questionable momentum on U.S. tax reform) all outperformed Barclays Aggregate Index, even with total returns in the low single digits over the first half.
Large Cap Value Update
(Not all clients of Bristlecone are invested in our Large Cap Value Equity portfolio strategy depending on the size of the portfolio, and the client’s objectives and constraints)
Our average Large Cap Value portfolio rose just under 3% in Q2, bringing the total return through the first six months of 2017 to over 9% in line with the S&P 500 index, when including dividends (your own portfolio results may differ – please refer to your Quarterly Portfolio Review Report). On balance, we bought more than we sold in the second quarter. We purchased a new position in Amerco (UHAL), added to an existing position in New York REIT (NYRT), and sold a long-term holding in General Dynamics (GD).
Amerco (UHAL) is a new position for the Large Cap Value portfolio. While the corporate name is rather ambiguous, its stock ticker gives a hint at the nature of the business: Amerco is the corporate parent of the ubiquitous U-Haul equipment rental business. This family-owned business is not widely followed on Wall Street, since over 60% of the shares are closely-held by the founding family and its employees. Nevertheless, over two generations of Shoen family ownership, U-Haul has carved out an impressively dominant share of the “do-it-yourself” moving equipment market in the U.S. (their fleet is estimated to be 6 to 7 times the size of their nearest competitor). The DIY equipment rental business is one with pronounced competitive advantages, namely network effects and high barriers to entry.
Moreover, UHAL has ample opportunities to reinvest its profits at attractive rates of return—a compounding ability which is less common among the typical Large Cap U.S. company (many of which face substantial investor pressure to repurchase shares, or chase ill-advised acquisitions, precisely because they lack adequate reinvestment opportunities). More recently, UHAL has been investing in a fast-growing and highly profitable business which is also complimentary to their core equipment rentals: self-storage. UHAL’s self-storage revenues are still less than 10% of total sales, but in terms of square footage, their portfolio rivals that of a few other publicly-traded peers (which trade at much higher valuations). At our average cost, we believe we are paying a fair price for UHAL’s core equipment business, while also getting a free option on the future growth in self-storage.
Also on the buy side, we added to our “special situation” investment in New York REIT (NYRT). During the quarter, the company adopted new accounting guidelines (in accordance with its plan of liquidation), which required management to make an estimate of the firm’s net asset value (NAV) based on the likely timing and sales proceeds from specific properties. Obviously, this involves a fair amount of guesswork, and in situations like this management tends to be conservative in their estimates. Nevertheless, the revised NAV for NYRT came in at the low end of previously published estimates, which caused the stock to sell off 11% in a single day. We think it likely that NYRT’s liquidation value will ultimately be higher than the stock’s recent price—though the extent to which that is true is heavily reliant on the pace of property sales within the portfolio.
Finally, we sold our remaining position in General Dynamics (GD), a position which we had held in the LCV portfolio continuously since 2002. Over the years, we’ve added to and trimmed the position as the stock price fluctuated around our estimate of the firm’s intrinsic value. In the last decade or so, GD’s core defense business came under pressure due to federal budget constraints, even as their higher-margin private jet business (Gulfstream) expanded. Though overall revenue growth has been stagnant for 8 years, the firm was able to increase margins and operating earnings due to the mix shift toward the jet business. Moreover, GD aggressively plowed its free cash flow into share repurchases, which shrunk the share count and magnified the rather tepid growth in net income into double-digit growth in earnings per share. The market rewarded the stock with a valuation well in excess of even our most optimistic estimates. For perspective, the last time we added to our position in GD was in August of 2011, at which point it was trading at 8.5x trailing earnings. By the time we sold in May, that earnings multiple stood at 20.5x. GD has been a great investment and we would gladly consider owning it again…at the right price.
Time Flies
We are now more than 8 years into a stock market recovery which has seen the S&P 500 index nearly quadruple in value from its low. Inflation is tame, interest rates remain low, credit spreads are narrow, stock volatility is muted, and the largest American banks have finally seen their balance sheets rehabilitated (for the first time in 7 years, all 34 of the largest U.S. banks passed the Fed’s annual “stress test” in June, and were given approval to increase dividends and repurchase shares). The U.S. economy has added over 13 million new jobs since the Great Recession, the longest period of sustained job growth on record (in May, the unemployment rate hit a 16-year low of 4.3%). In short, there are plenty of valid reasons why the stock market is currently trading near all-time highs.
While attempting to time the market is a fool’s errand, it is both reasonable and prudent to periodically reassess your investment plan in light of changing life circumstances, age, and other factors. After all, a lot can change in 8 years! During your portfolio reviews with Bristlecone, we encourage you to keep an open dialogue with us on possible changes to your financial circumstances or retirement timeline, so that we can most effectively balance your risk tolerance and investment objectives.
As always, we encourage your comments and feedback, and appreciate your continued trust in our services.